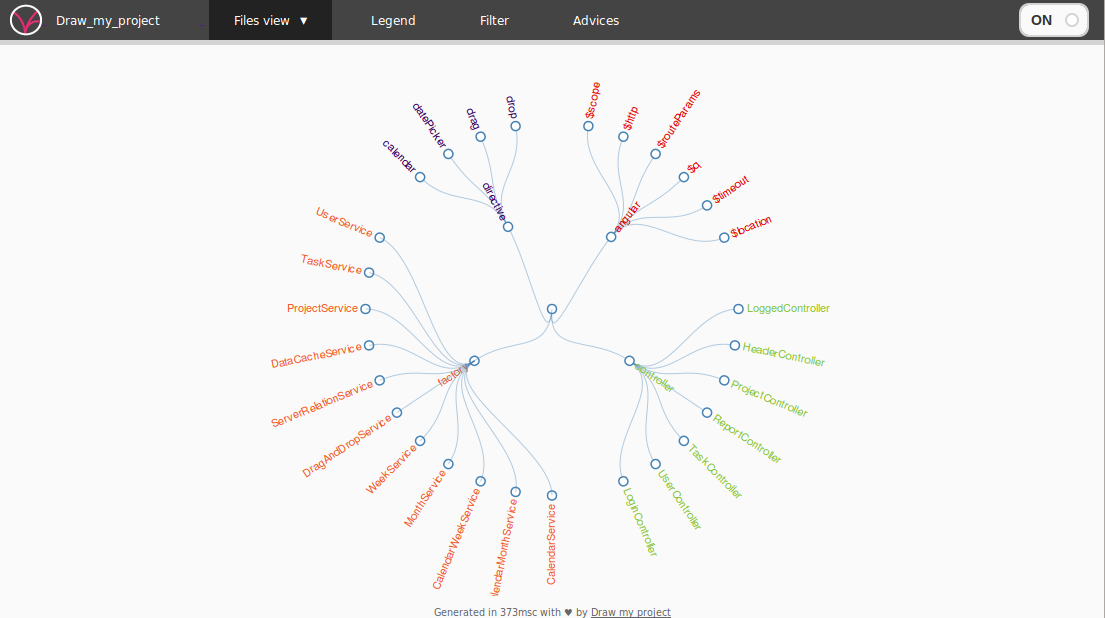
Thanks to 1 grunt task, you can transform your code into a graph !
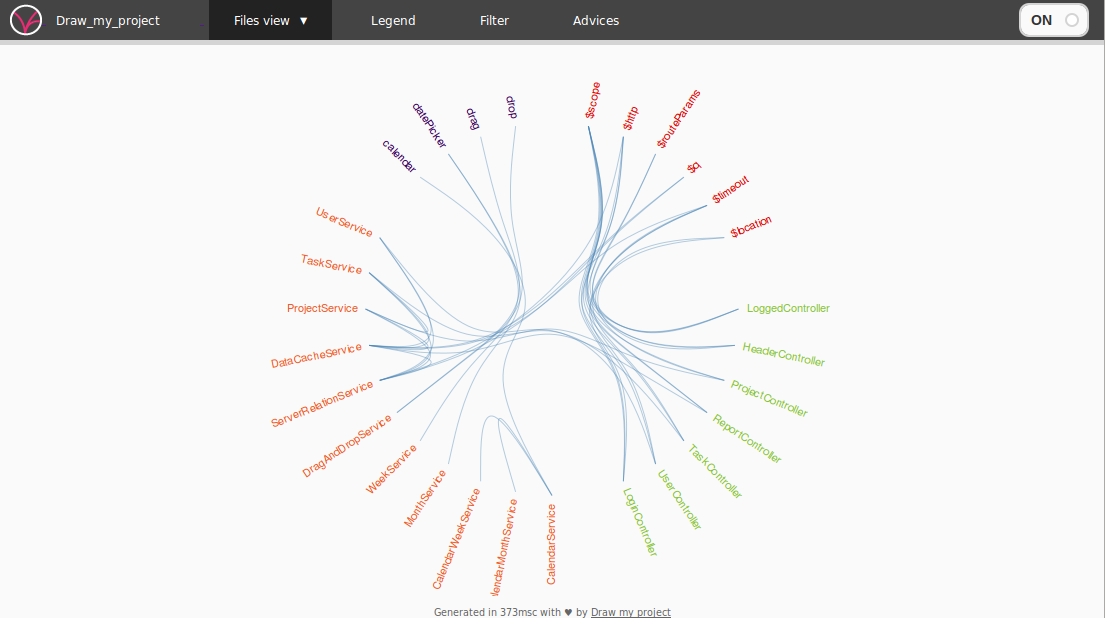
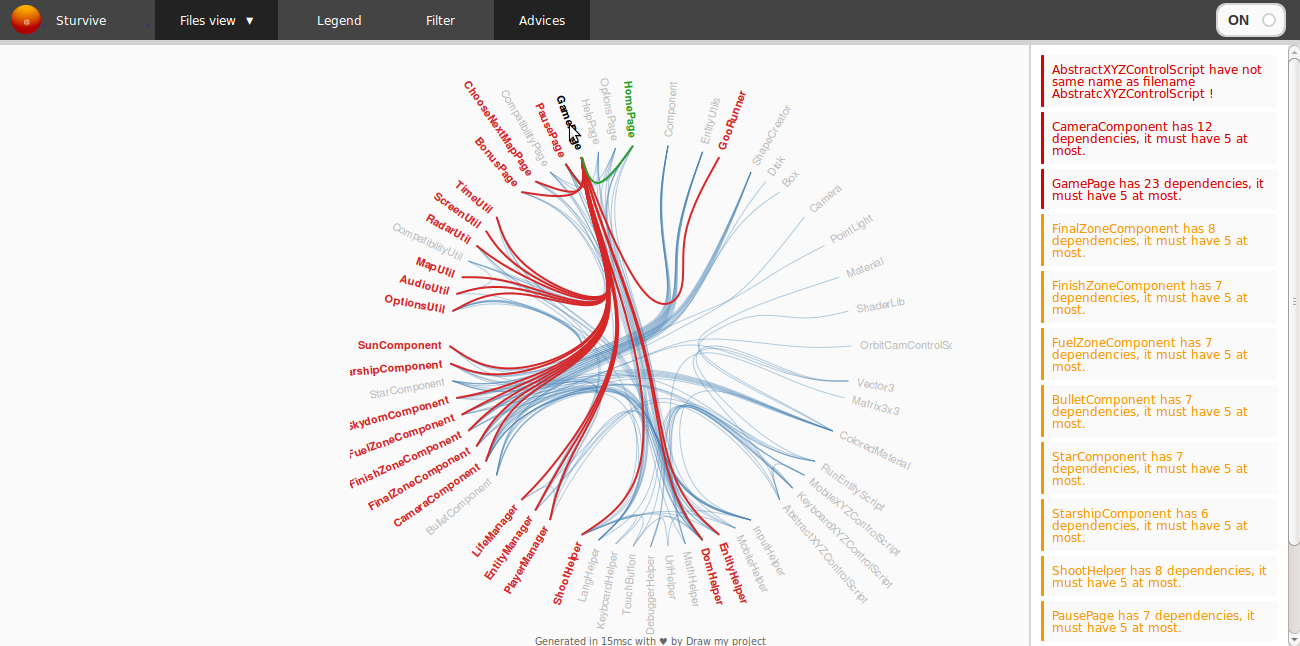
If I change this file, how the other files will be impacted ?
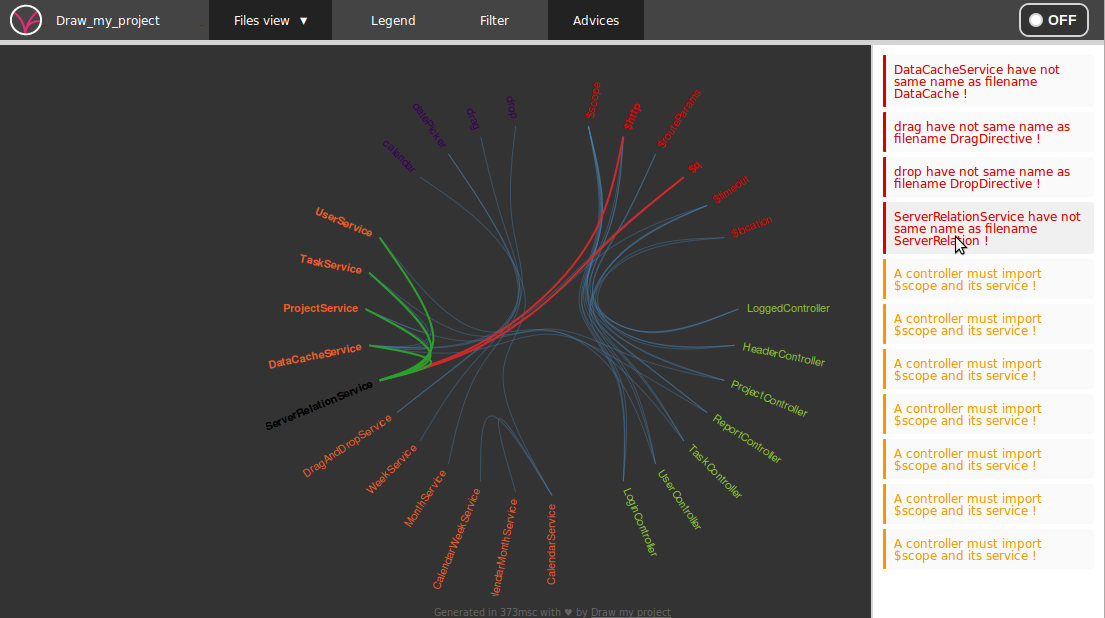
Just hovering a node to display files (green links) which may be impacted !
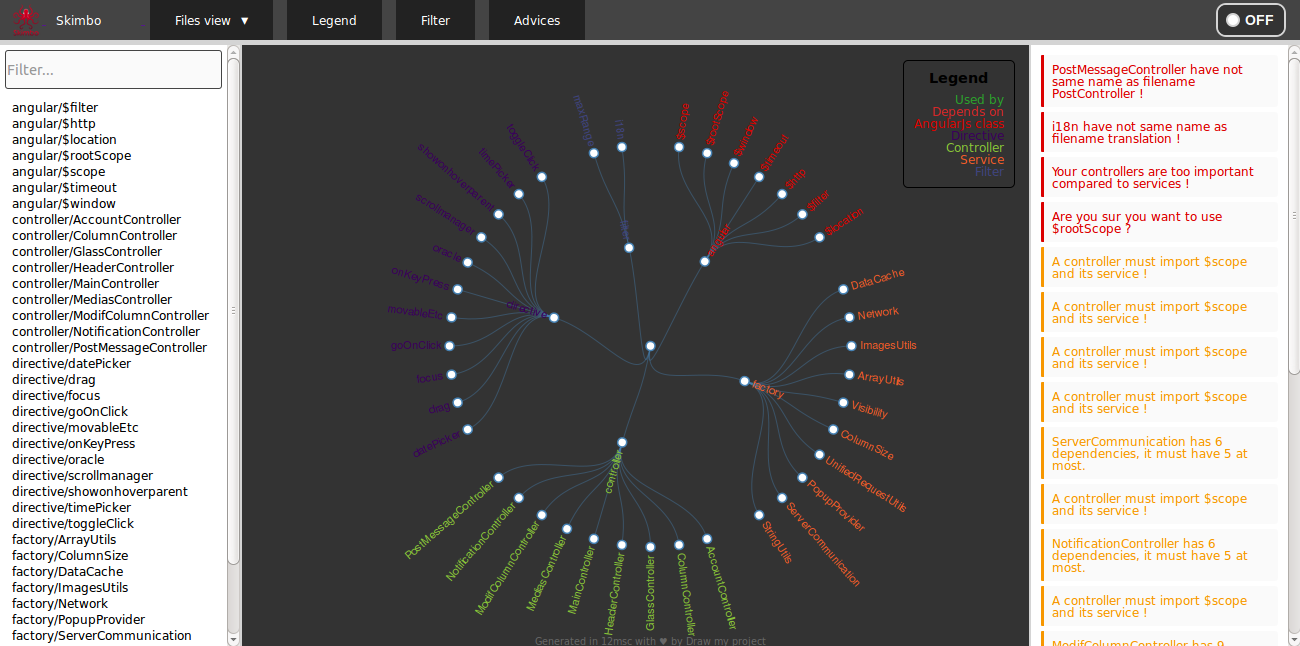
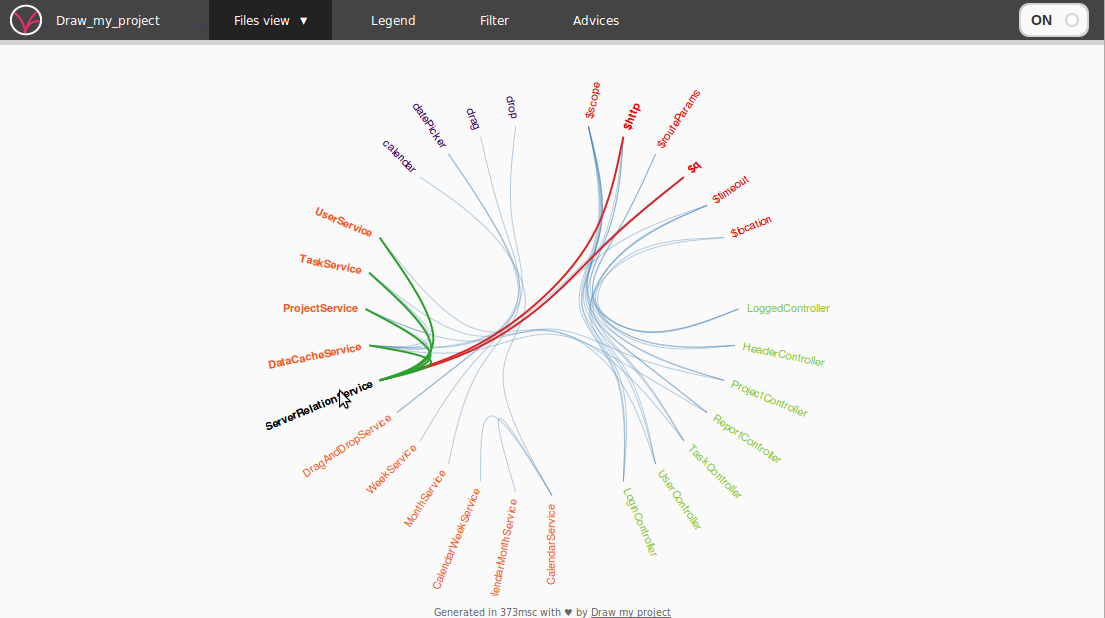
Oh yes, a legend to understand more easily.
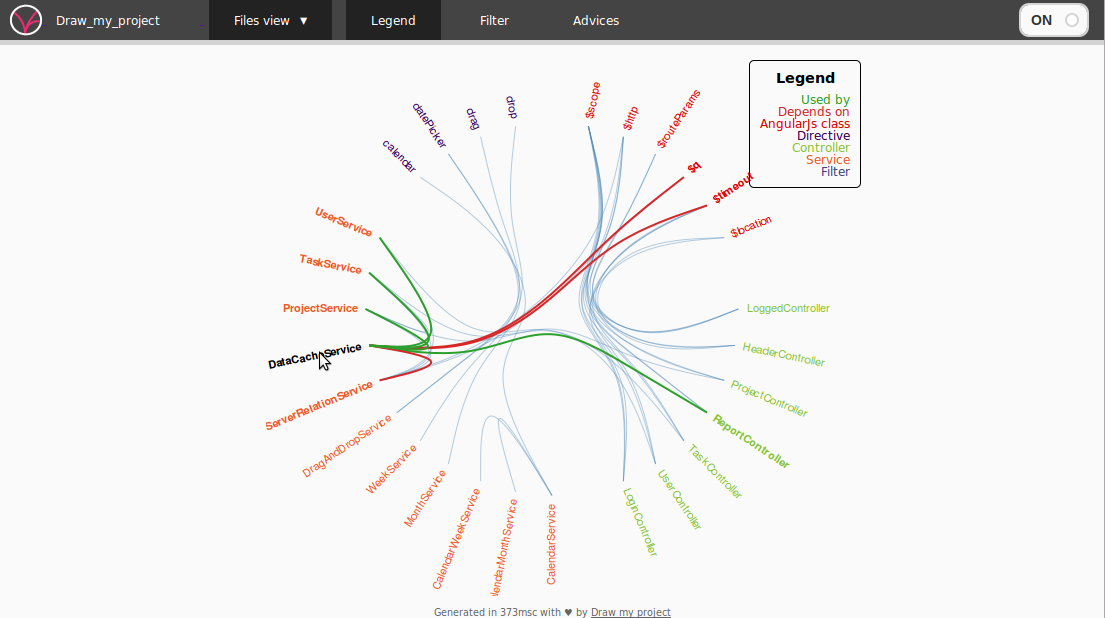
Click on the `Legend` button to show/hide the legend !
Oh yes, a filter to easily find a node.
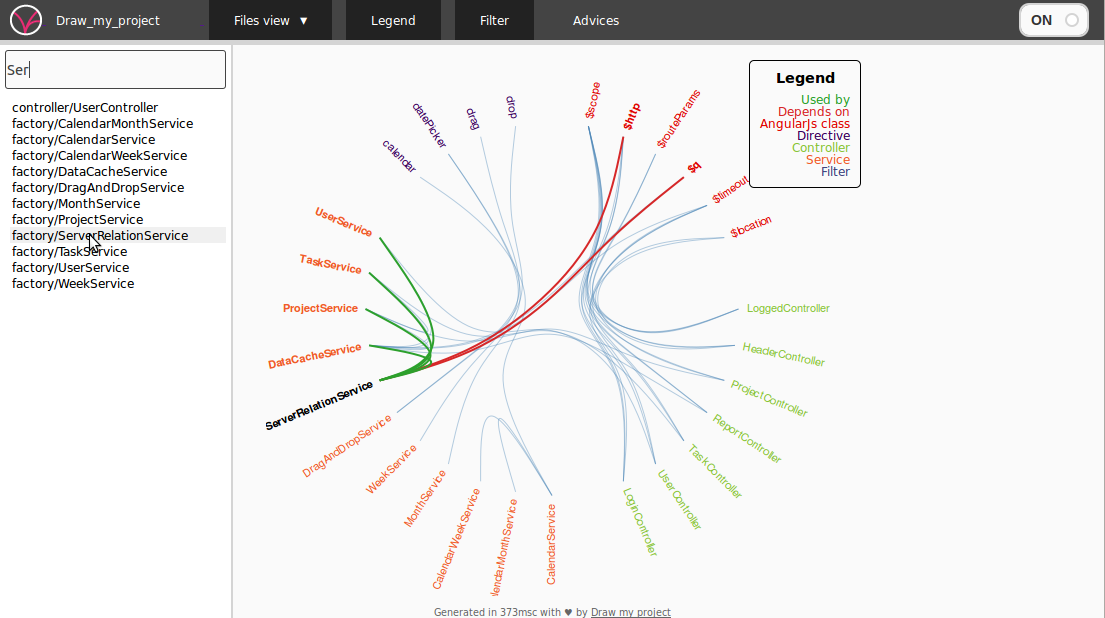
Click on the `Filter` button to show/hide... the filter ! Amazing isn't it ?
The last but not the least : Advices !
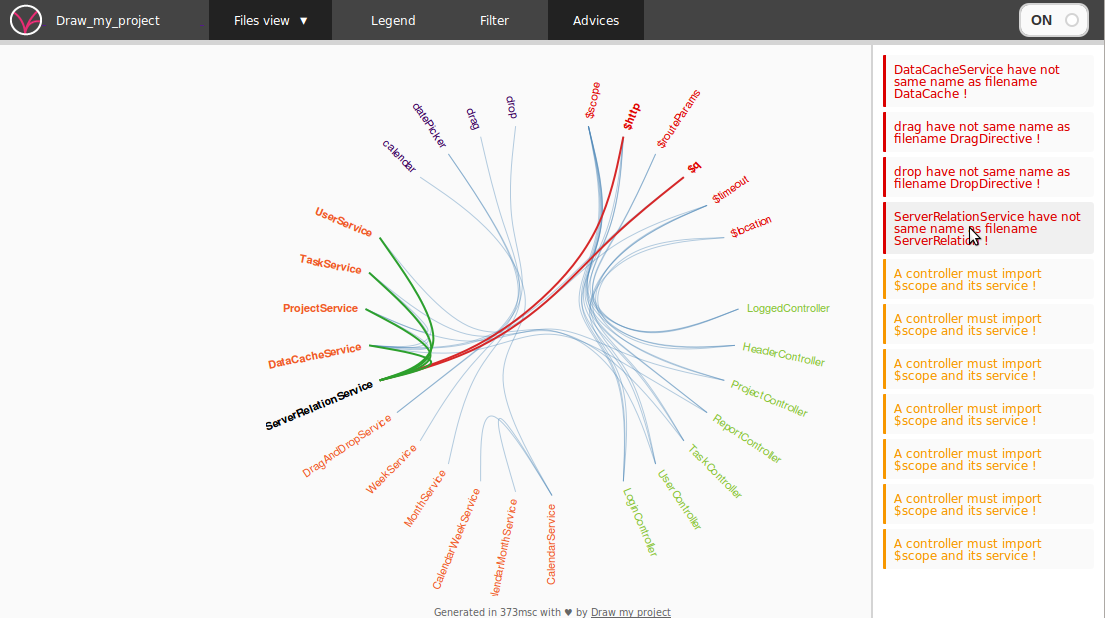
Click on the `Advices` button to show/hide... Ok you know... ! Available advices.
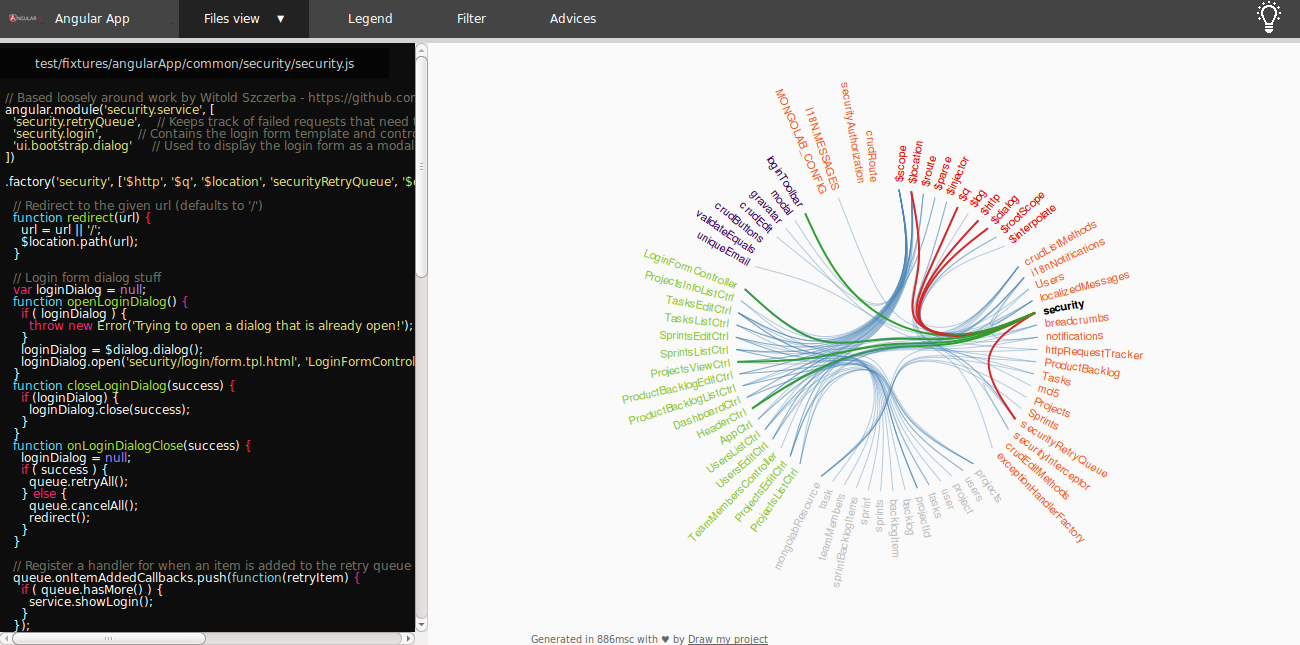
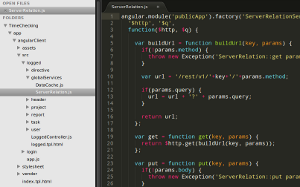
Why not see directly sources ?
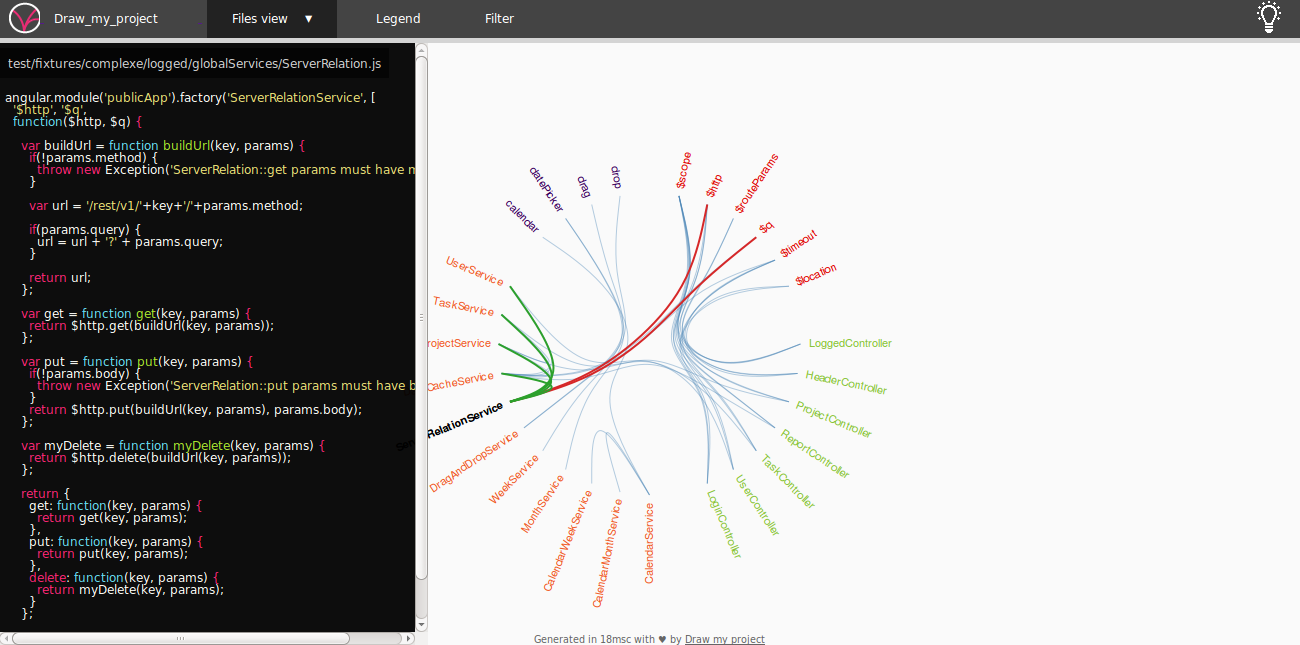
Click on a node to see its sources.
Zoom/drag
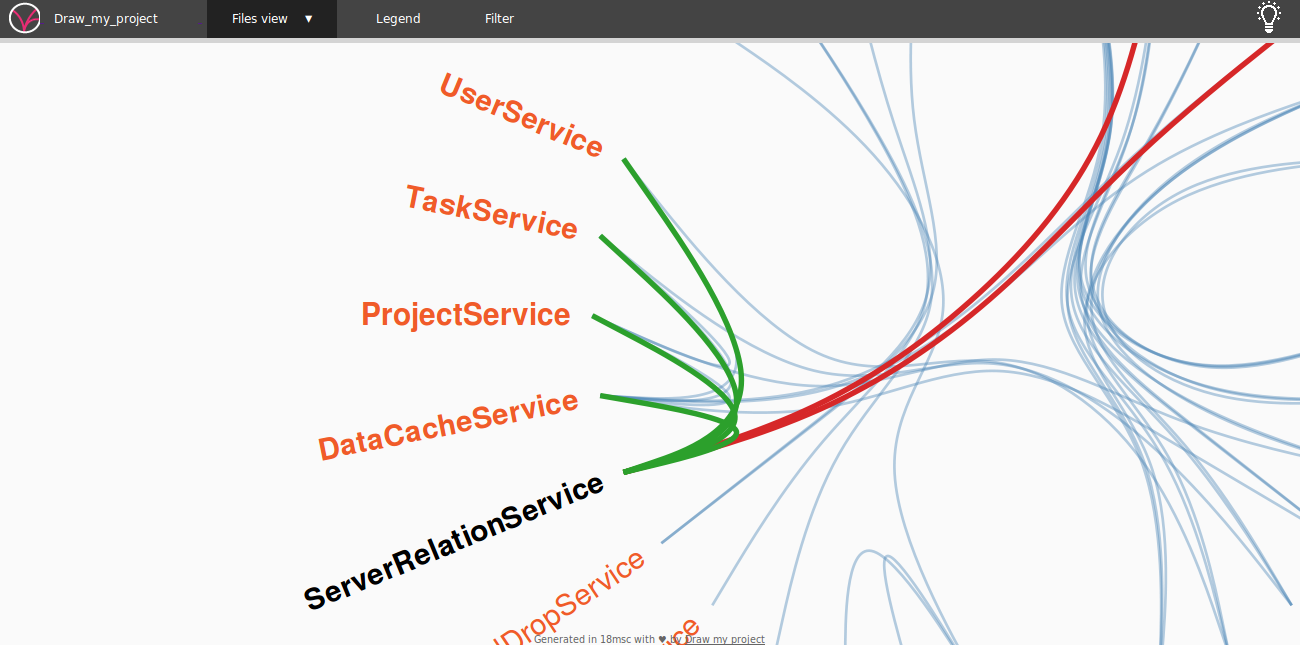
Your sources, your project, your point of view !
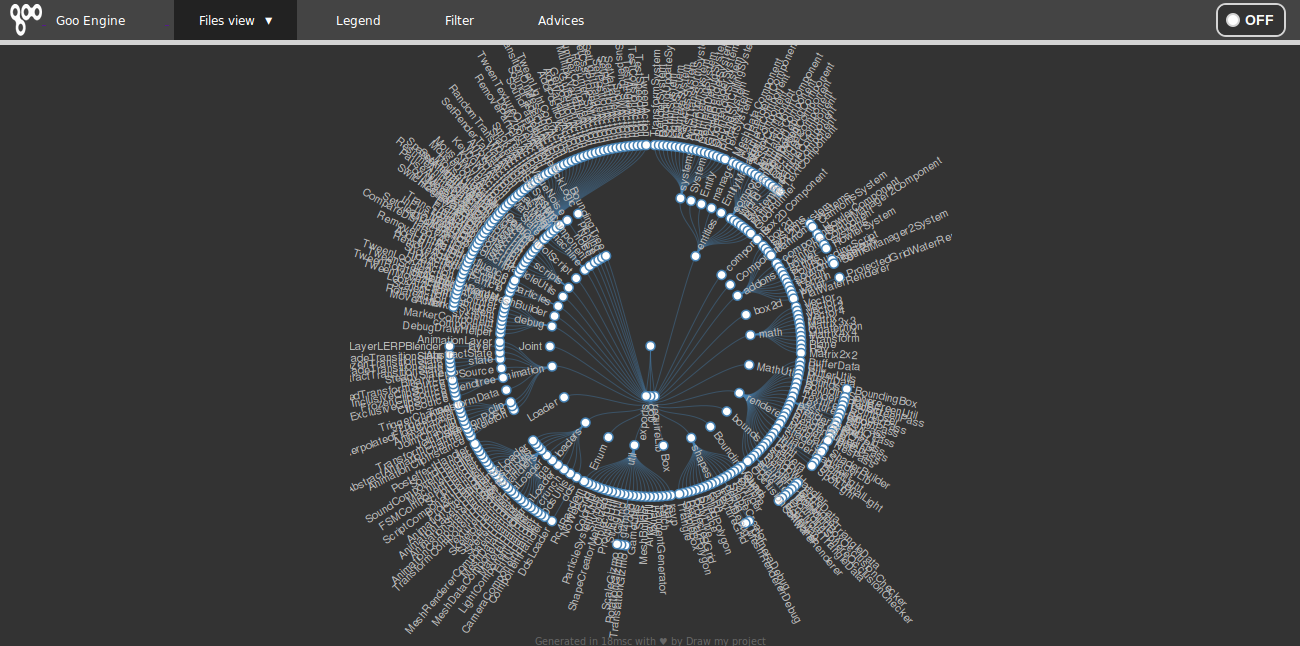
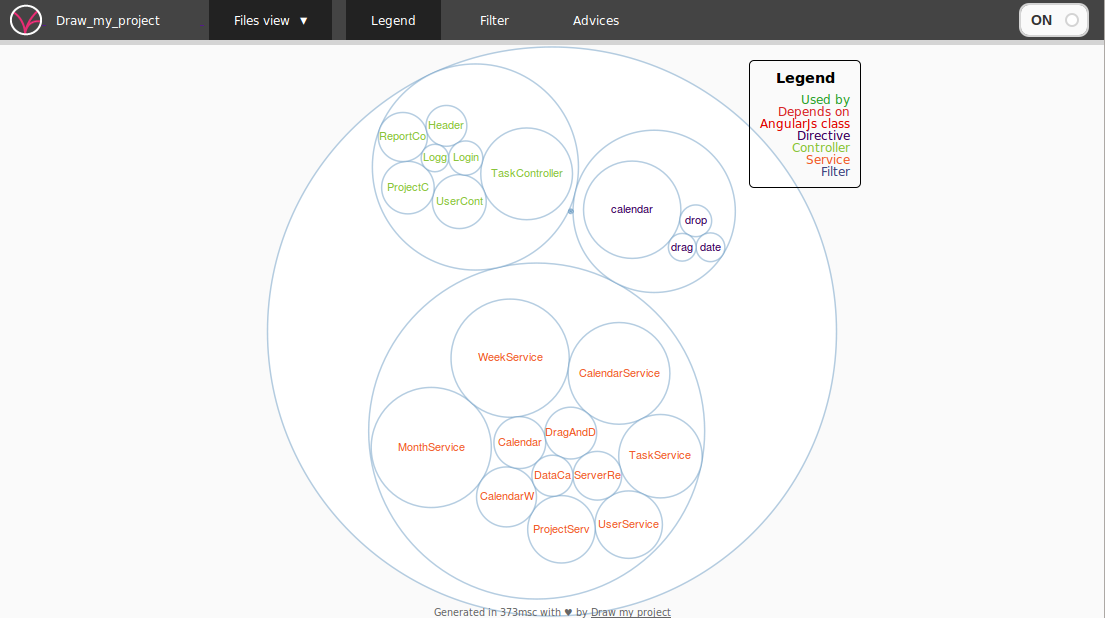
Why don't you look at the other kinds of graphs ?
Click on the `Files view` button to change the graph type.
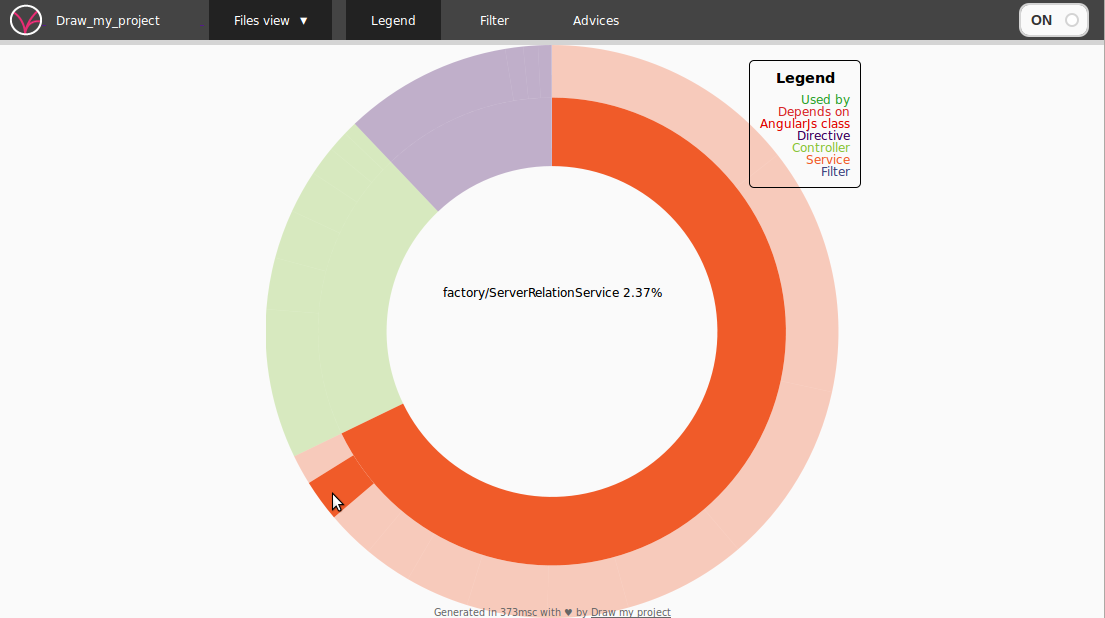
Look for the biggest file by type.
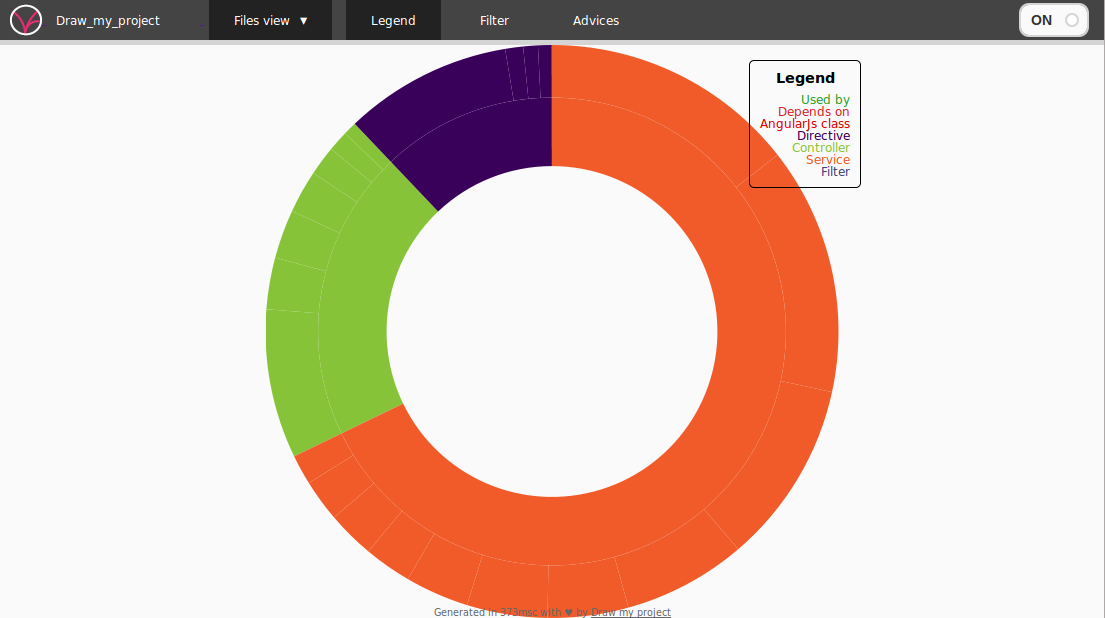
Size chart.
Or directly by file.
Size chart by type.
Oh yes, of course, all graphs have the same features no matter what type they are !
And more...
Works with :
- AngularJs
- RequireJs
- NodeJs (in test)
- Java (in development)
Customizable :
- Your project's logo
- Your project's name
- Your advices
Funny ! Turn off the light !
Showcases